This week we are taking a look at some of Seattle’s neighborhoods and seeing what median sales prices did in a year-over-year comparison.
Note: Areas with fewer than 12 sales per month (indicated by the shaded blue) are usually not good subjects for looking at a price change trend. Stats below include residential + condos.
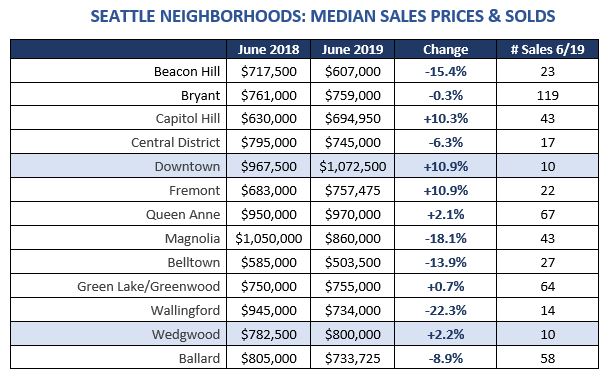
SEATTLE NEIGHBORHOODS: MEDIAN SALES PRICES & SOLDS
| June 2018 | June 2019 | Change | # Sales 6/19 | |
| Beacon Hill | $717,500 | $607,000 | -15.4% | 23 |
| Bryant | $761,000 | $759,000 | -0.3% | 119 |
| Capitol Hill | $630,000 | $694,950 | +10.3% | 43 |
| Central District | $795,000 | $745,000 | -6.3% | 17 |
| Downtown | $967,500 | $1,072,500 | +10.9% | 10 |
| Fremont | $683,000 | $757,475 | +10.9% | 22 |
| Queen Anne | $950,000 | $970,000 | +2.1% | 67 |
| Magnolia | $1,050,000 | $860,000 | -18.1% | 43 |
| Belltown | $585,000 | $503,500 | -13.9% | 27 |
| Green Lake/Greenwood | $750,000 | $755,000 | +0.7% | 64 |
| Wallingford | $945,000 | $734,000 | -22.3% | 14 |
| Wedgwood | $782,500 | $800,000 | +2.2% | 10 |
| Ballard | $805,000 | $733,725 | -8.9% | 58 |
Overall Seattle’s median sales price shrank by 4.5% for residential and 4.8% for condos.
If you have questions on the above or want additional information on what is happening in your Seattle neighborhood, reach out!
