As reported in last month’s State of the Market, a reduction in inventory (houses for sale) has caused prices to generally rise in Seattle despite lower sales volume. The biggest question in that blog post was whether the dip in sale price from April to May was a new trend or an anomaly. In this month’s State of the Market, we look at this question and the trend in Seattle inventory.
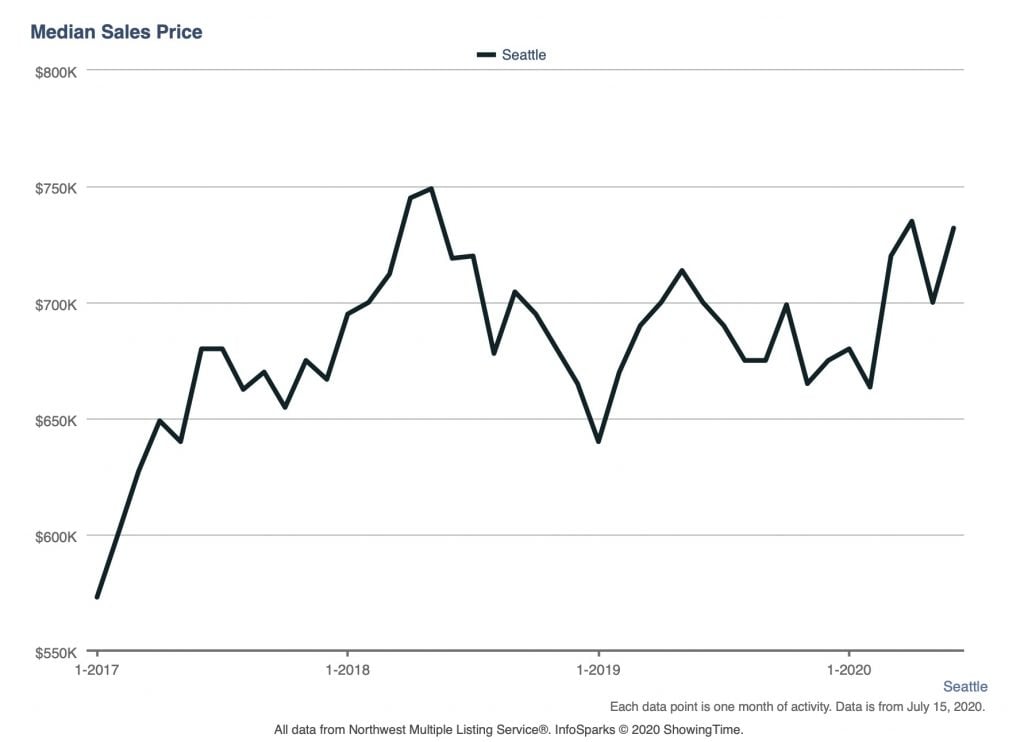
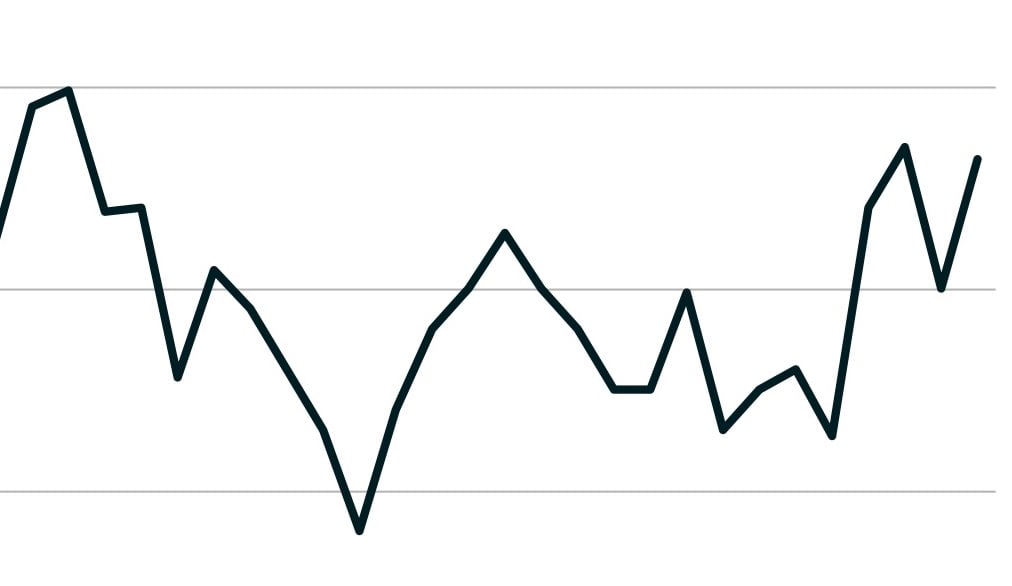
The graph above shows the median price of home sales in Seattle from January 2017 to June 2020. As shown, the downturn from April to May reversed in June, hitting $732,000, just below April’s $735,000. These are the third and fourth highest numbers on the graph, lower only than April 2018 ($745,000) and May 2018 ($749,000).
According to the July Press Release (PDF) by the Northwest Multiple Listing Service, these trends of high prices and low inventory hold throughout the central Puget Sound (King, Kitsap, Pierce, and Snohomish Counties), with King County’s price rise of 5.9% being the smallest.
Next, let’s look at inventory.
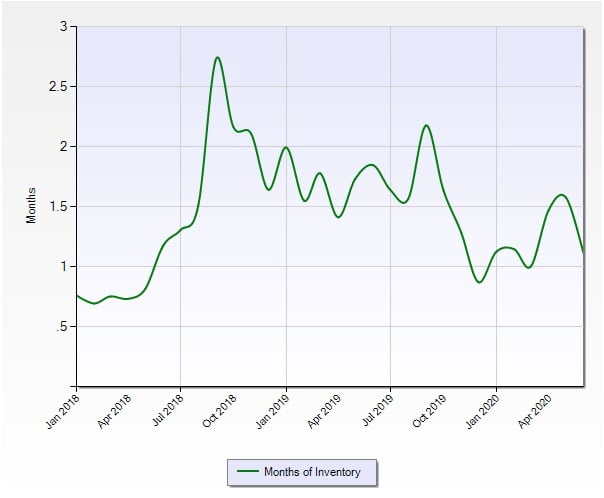
As we saw last month, the inventory was rising up through May, but as this graph shows, the amount of inventory then dropped precipitously in June. If the law of supply-and-demand operates as normally, prices in Seattle should climb in proportion as long as demand keeps pace.
Please note that, unless otherwise noted, this article refers exclusively to residential real estate in Seattle. This article is an opinion of the writer and should not be considered financial advice. Always consult a real estate professional before investing or divesting in real estate.
Copyright notice for graphs and data provided therein: Information and statistics compiled and reported by the Northwest Multiple Listing Service
